Slovenia’s path to sustainable development is still beyond planetary boundaries, despite its better performance compared to the EU. We analyse Slovenia’s ecological footprint and propose concrete measures to reduce it. Adapting national policies and strategies will enable sustainable development and living within the limits of our planet.

Slovenia's Ecological Footprint, Biocapacity and Consumption

In 2017, Slovenia adopted the Slovenian Development Strategy, in which it committed to reduce the country’s ecological footprint by 20% by 2030 (from 4.7 gha per capita in 2013 to 3.6 gha per capita in 2030). The Global Footprint Network’s projections for 2022 show that Slovenia’s ecological footprint in 2022 is 4.78 gha per capita and its biocapacity is 2.49 gha, which is almost 2 times less than the footprint. Slovenia’s ecological footprint is above the European average (4.65 gha per capita).

The carbon footprint is the largest component of Slovenia’s ecological footprint (50% in 2022), although it is comparable to the European and global average. Forest products are the most significant contributor to Slovenia’s ecological footprint (45% higher than the European average in 2022), while built-up and cultivated areas and fishing grounds have a much lower share.
A graph, showing the ecological footprint of Slovenia by component.
Biocapacity of Slovenia and Europe in relation to surface area (2022)
A graph showcasing the biocapacity of Slovenia and Europe in relation to surface area for the year 2022.
In 2022, Slovenia’s biocapacity was 2.49 gha per capita, below the European average of 3.31 gha per capita. Forests contribute the largest share (74%), while the contribution of arable land is much lower than the European average (16% compared to 40% in Europe).
Text, showing how the total ecological footprint of consumption is calculated.

The total ecological footprint of consumption is the sum of the footprint of production in the country with the footprint of imports into the country, minus the footprint of exports out of the country.

Slovenia consumes more than it produces, which means that Slovenia is a net importer of the ecological footprint of production. In 2017, the size of net footprint imports and exports was larger than production in all but one category. Slovenia is an exporter of footprint only in forestry.
Imports and exports of ecological footprint in Slovenia (2017)
A graph showcasing the imports and exports of ecological footprint in Slovenia for the year 2017.
Ecological footprint composition by consumption category (2019) Source: ARSO, 2024; cited in GFN Slovenia Consumption Land Use Matrix (CLUM) 2023
A graph showing the contribution to the ecological footprint of Slovenia by type of consumption in the year 2018.
By type of consumption, the largest contributor to Slovenia’s ecological footprint in 2018 was housing (26% of the total ecological footprint in 2019), followed by personal transport (20%), services (18%), food (19%) and goods (17%).

Ecological footprint categories - consumption and land

Ecological footprint categories - consumption and land.

2. Ecological footprint of Slovenia

In 2022, Slovenia’s average ecological footprint was estimated at
0 gha
(the target value to be achieved by 2030 is 3.6 gha per capita)
Prikaz razmerij ekološkega odtisa potrošnje za različne kategorije zemljišč.
Total ecological footprint of consumption (2022)
0 .073 gha

Grazing Land

Forest Products

Built-up Land

Cropland

Fishing Grounds

Carbon Footprint

The total ecological footprint measures how many natural resources we consume to sustain our lifestyle.

Grazing Land

Forest Products

Built-up Land

Cropland

Fishing Grounds

Carbon Footprint

The total ecological footprint measures how many natural resources we consume to sustain our lifestyle.
Prikaz razmerij skupne kapacitete za različne kategorije zemljišč.
Total biocapacity (2022)
0 .580 gha

Grazing Land

Forest Products

Built-up Land

Cropland

Fishing Grounds

Total biocapacity represents the ability of natural ecosystems to regenerate and provide the resources necessary for our survival.

Grazing Land

Forest Products

Built-up Land

Cropland

Fishing Grounds

Total biocapacity represents the ability of natural ecosystems to regenerate and provide the resources necessary for our survival.
According to Slovenia’s biocapacity, in order to meet its needs, its land area would have to be multiplied by

3,17 Slovenias

Every day we consume the resources provided by the Earth. This is our ecological footprint.

We must reduce our ecological footprint, for we have only one precious Earth to protect.

Source: Global Footprint Network, 2024, data.footprintnetwork.org

Ecological footprint by statistical region

The Operational Plan for the Cooperation of Ministries in the Preparation of Regional Development Programmes 2017-2027 (adopted in 2019) stipulates that the state of the environment in terms of quality of life is monitored on the basis of the ecological footprint of specific regions.
Data from 2018 show that the Osrednjeslovenska statistical region is expected to have the largest ecological footprint, at 5.8 gha per capita, 8% higher than the national average (5.37 gha per capita in 2018). Slovenia’s most populous and wealthiest region thus contributes a quarter of Slovenia’s total ecological footprint. The regions with the smallest ecological footprint per capita are Pomurska (4.81 gha per capita) and Goriška (4.79 gha per capita), 10% below the national average.

Ecological footprint per capita by statistical region of Slovenia (2018)
Source: ARSO, 2023

A map showcase of the ecological footprint per capita by statistical region of Slovenia in 2018.
In all statistical regions of Slovenia, the largest ecological footprint per capita is caused by the carbon footprint and the forest products footprint. The carbon footprint per capita is the largest in the Osrednjeslovenska statistical region, but its share in the total footprint in Slovenia in 2018 was 62% and it is the main source of the ecological deficit that can be directly addressed through decarbonisation. The forest products footprint is largest in forested and cold regions such as South-Eastern Slovenia and Carinthia, where annual temperatures are on average lower and woody biomass is an easily accessible source of heating.
Ecological footprint of regions and Slovenia per capita by land category (2018)
A graph showing the ecological footprint of regions and Slovenia per capita by land category in 2018.
Breaking down the ecological footprint of the statistical regions further into the individual consumption categories, the largest footprint is caused by “housing, water, electricity, gas and other fuels”, followed by “transport” and “food and non-alcoholic beverages”. Together, these three categories account for two thirds of resource consumption.
Ecological footprint of regions and Slovenia per capita by (COICOP) consumption category (2018)
A graph showing the ecological footprint of regions and Slovenia per capita by (COICOP) consumption category in 2018.

Measures and scenarios

Following Slovenia’s commitment to reduce its ecological footprint by 20% by 2030, the Ministry of the Environment, Climate and Energy has provided funding for monitoring the ecological footprint and analysing potential measures. These studies are carried out within the Slovenian Environment Agency.

The latest study (2023) showed that various ambitious measures in the areas of sustainable forest management, sustainable mobility and energy efficiency can contribute to reducing Slovenia’s ecological footprint. The ecological footprint measures how much natural resources we consume, so reducing it means less pressure on the environment.
Sustainable forest management can increase the ecological footprint in the baseline scenario (3.27%), but additional measures can lead to a significant reduction in the footprint (-5.82%).

Electromobility, or the use of electric vehicles, can reduce the ecological footprint by -3.51% in the baseline scenario, but additional measures increase this reduction further to -6.14%.

The development of public passenger transport and cycling networks can already reduce the ecological footprint by -2.49% in the baseline scenario, while additional measures can reduce it by up to -5.97%.

Energy efficiency and the use of renewable energy sources in buildings reduces the ecological footprint by -4.35% in the baseline scenario, with additional measures reaching as much as -7.06%.

Together, these measures lead to a reduction of the ecological footprint of 7.08% in the baseline scenario and as much as 24.99% with additional measures.

Comparison of scenarios in five areas to reduce Slovenia's ecological footprint

A table, showing the comparison of scenarios in five areas to reduce Slovenia's ecological footprint.

Source: Slovenian Environment Agency, 2023 (preračuni Stritih d.o.o.)

The cost-benefit analysis shows that a large part of the measures is feasible through the removal of administrative barriers and financial reforms. Removing legal restrictions and adapting EcoFund regulations would facilitate the deployment of solar power plants. Measures for sustainable forest management require a longer financing cycle. Green tax reform is needed to achieve the objectives.
Energy renovation of buildings, renewable energy and sustainable mobility are key measures. Forests are a major contributor to Slovenia’s biocapacity and their sustainable management is important.

The biggest challenges are in public transport and rail infrastructure in the Ljubljana region. Actions are complementary, which accelerates the achievement of the targets.

The 2023 analysis showed that additional measures in different areas could reduce Slovenia's ecological footprint by as much as 24.99%. Despite some missed opportunities and the increase in the ecological footprint over the last decade, there is still significant potential for reduction, especially through decarbonisation and technological change. Rapid reforms in the transport sector, such as expanding electromobility, improving public transport and cycling networks, and strengthening the renewable energy network and energy efficiency in buildings, are key to achieving these goals.

Planetary boundaries

Discover various approaches to evaluating planetary boundaries and their consideration in the green transition.

The informational material includes detailed explanations of research approaches, analyses, and graphical representations.
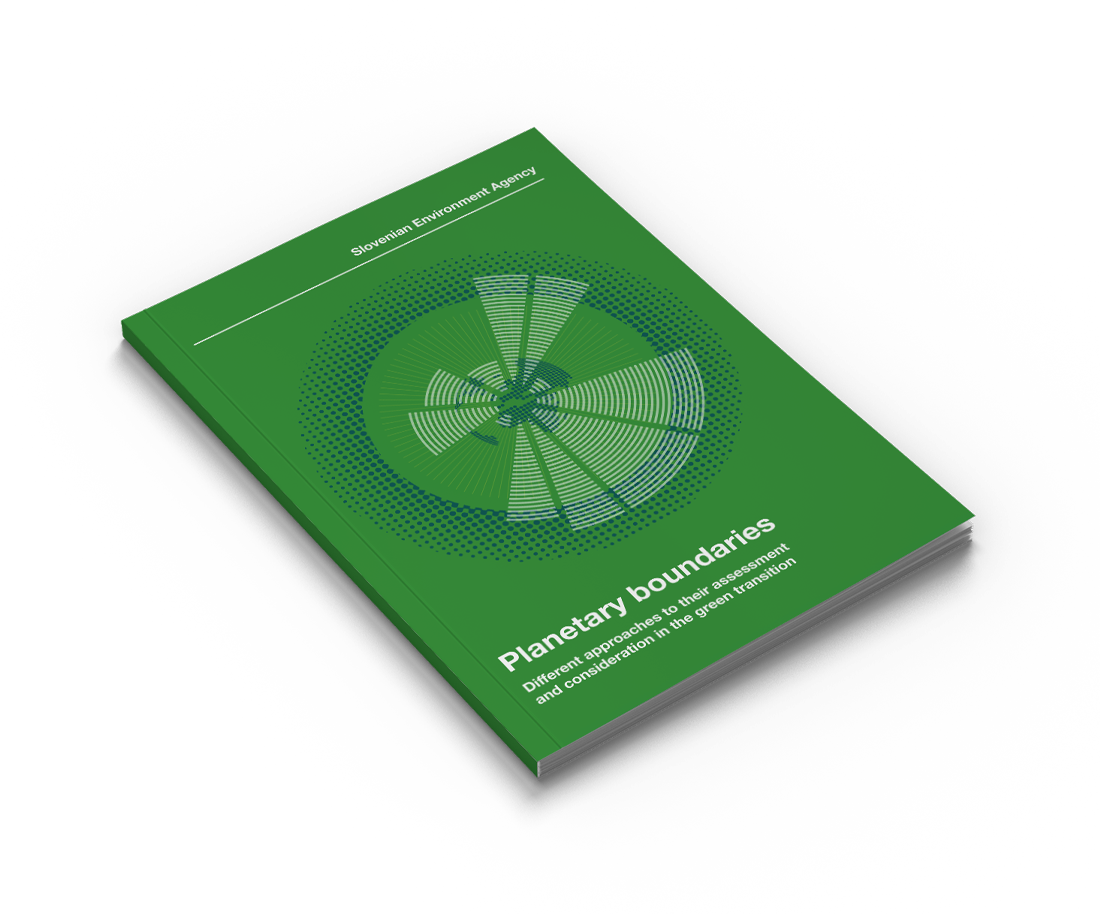
The cover of the Planetary boundaries brochure.